Software developers are very familiar with the traditional debugging process: first open the debug dialogue, stop the application at the breakpoint, step through the code, check the data, find the bug, build, and repeat the steps again. All software development environments provide these basic functions. But this cycle and the large number of tools that implement the method can only debug one problem at a time.
Now we have entered the multi-core era. In general, "multicore" refers to a chip that contains more than one logical device for executable code (eg, multiple processors, processors and digital signal processors (DSPs), processors, and field programmable gate arrays ( FPGA)). At the same time, it can also refer to multiple processors on a target board. For companies that build development tools, multicore should theoretically be an extension of existing methods of use. After all, equipment software development tools have solved a large number of "multiple": multi-object, multi-processor, multi-process, multi-threaded, multi-operating system, multi-debugging interface, multi-debugging engine, and even a variety of programming languages.
In fact, it is very difficult to deal with so many different "debug entities" using a single development tool. Different operating systems often require the use of different debugging engines, such as GDB or vendor-specific debugging engines. In addition, they also need to use different debug connections, including network or JTAG. Some debug engines can only support several specific processors. Other debuggers are designed primarily for bare-metal access to the chip through debugging software. In many cases, such debuggers cannot debug applications using operating system debug agents. With the ever-increasing richness of embedded devices, the tools needed to develop and debug these device software are also emerging.
Universal Framework
In order to solve the above problems, a common framework needs to be established so that multiple sets of development solutions from different vendors can realize interoperability. What delights device software developers and tool vendors is that this framework is now available, namely: Eclipse(). Eclipse is not only an open source community, it also gathers together open source software projects, from Java development to software testing infrastructure, to business report generation, and it offers a wide range of content. The most important feature of Eclipse is the creation of frameworks and tools that enable companies to build commercial products and solutions based on high-end Eclipse technology.
E clipse technology can support all currently used development languages, including Java, C/C++, Perl, Ruby, Fortran, and even COBOL. The two most prominent language projects in Eclipse are Java Development Tools (JDT) and C/C++ Development Tools (CDT). Both have rich features to support the "edit-compile-debug" loop mentioned above. These features include: an editor with code highlighting and completion, code review and refactoring, and managed compilation (managed build) and debugging features.

However, most closely related to multicore debugging is that both and other language development projects can build their own debuggers on a framework called the Eclipse platform debug model. The framework provides a common building block for the debugger, making the debugger look like memory, registers, and expressions; its debug structure is concise, showing processes, threads, and stack frames; for start, stop, step In and breakpoints run control activities; and have launch mechanisms for launching debugging sessions. The framework has been extended to work with a variety of debugging engines.
At present, there are many equipment software developers who have built Eclipse high-end technology commercial products to realize the need for further customization of the framework. These companies jointly launched an Eclipse project (Device Debugging) in June 2005. Its members include development tool vendors, operating system vendors, and semiconductor manufacturers. The project is dedicated to building enhanced debug modules, application programming interfaces (APIs), and views that can amplify the Eclipse platform for device software development. To date, the Device Debugging project has evolved the existing Eclipse debug module into a more versatile and customizable set of interfaces. These interfaces can satisfy a wide range of commercial debugging solutions and have diverse requirements.
To customize Eclipse, the project extends the Eclipse platform debugging interface from the following three aspects:
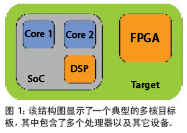
Flexible debug element structure with custom debugger behavior The debugger looks at content and updates policies entirely driven by the debug engine Full asynchronous interaction between the user interface (UI) and the debug engineFirst, the flexible debug element structure allows the debug engine to break through the "process-thread-stack" architecture that is commonly used in host software development. In device software development, especially in multi-core environments, the processor type, operating system, and debug connections together determine the structure presented to the developer. For example, consider any target board with multiple processors and other devices (see Figure 1).
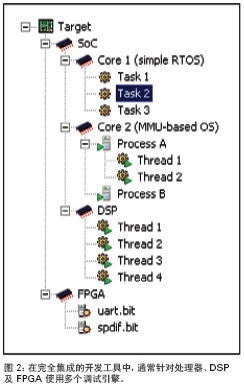
The target board has a field programmable gate array (FPGA) and system-on-chip (SoC) devices that contain two processor cores and one DSP. In a comprehensive development tool with a flexible debug architecture, developers will see the debug layout as shown in Figure 2. This example uses multiple debug engines, perhaps one for the processor, one for the DSP, and one for the FPGA. Each debug engine represents a debuggable environment for connection types and devices. This customization can also change the meaning of the debugger behavior on different nodes in the structure. For example, clicking the Go button when selecting a process will restart the process and all its threads. When you click the Go or Step button on a thread, the debug engine will only work on that thread, while other threads will keep their current running or stopped state.
Second, the new Eclipse debug model interface enables the debug engine to fully customize the content and update Eclipse's different debugger view strategies (such as memory, registers, locals, and expressions). This feature is very important because different debugging engines can provide different levels of visibility into processor resources and control these resources. For example, a debug engine that provides a JTAG connection to a target processor can often achieve higher availability of processor hardware registers. Therefore, when connected to the debug engine, the developer can see the Register view to reflect its details (eg, bit field description and control, system registers, and coprocessor registers). Because the memory and register access on the embedded target processor are real-time operations, the new debug model interface allows the debug engine to control the manner and timing of content updates.
Finally, the new interface enables full asynchronous interaction between the GUI and the debug engine, thereby improving the debugger's performance and responsiveness. The following example illustrates the advantages of fully asynchronous interactions. Imagine that the application being debugged contains several large data structures that developers will examine as they step through the code. The developer places these data structures in the Expression view and simultaneously monitors some of the key processor registers.
When the developers step through the code, all the data must be updated in each view, which will greatly reduce the overall stepping speed and make people feel annoyed. By implementing asynchronous interaction between the GUI and the debug engine and allowing the engine to control the view updates, the debug engine can interrupt the view refresh while the user can quickly step through the code. When the user pauses, the view can be refreshed.
These improvements to the Eclipse platform will be released as a temporary API in Eclipse 3.2 introduced in June of this year. This customizable debugging framework provides developers with an enhanced multi-core debugging experience. In Eclipse, multiple debug engines can interact with multiple objects at the same time, share debugger views, and provide a stable user experience. With this new framework, tool vendors can build debug solutions that can take full advantage of their core capabilities (such as processor architecture, operating system, and hardware debug connection methods) while enabling interoperability between multiple sets of solutions.

Although these features provide a good start for multi-core support, much work remains to be done to synchronize and potentially use multiple debug engines. Currently, running multiple debug engines at the same time using the same development language can create confusing workflows (eg, when the user is viewing a C file with two debuggers, only one debugger needs to be used to populate the breakpoint). In addition, the data display aspect of the multi-core debugging session also requires some work. Eclipse needs to be able to provide a debugger view that can be logically grouped for a specific debugging environment. Developers need to combine the resources, expressions, registers, and memory views of each core. They must also be able to easily distinguish the views of different kernels. In addition, there is a need to coordinate the release order among the kernels so that complex systems can be loaded and started simultaneously. These are the areas where the Device Debugging project will be improved next.
Fiber Fast Connector,Fiber Quick Connector,Fast Connect Fiber Connectors,Fiber Optic Quick Connector
Ningbo Fengwei Communication Technology Co., Ltd , https://www.fengweifiberoptic.com